
Most people are their own worst enemy when it comes to investing.
There’s a reason the market averaged just under 8% from 2001-2020 yet the average investor averaged under 3%.
Becoming more educated leads to better investing.
Here are 8 charts to help you become a better investor:
I see 2 types of people often:
Both of these are wrong. When you invest and own the market, it is not gambling. Far from.
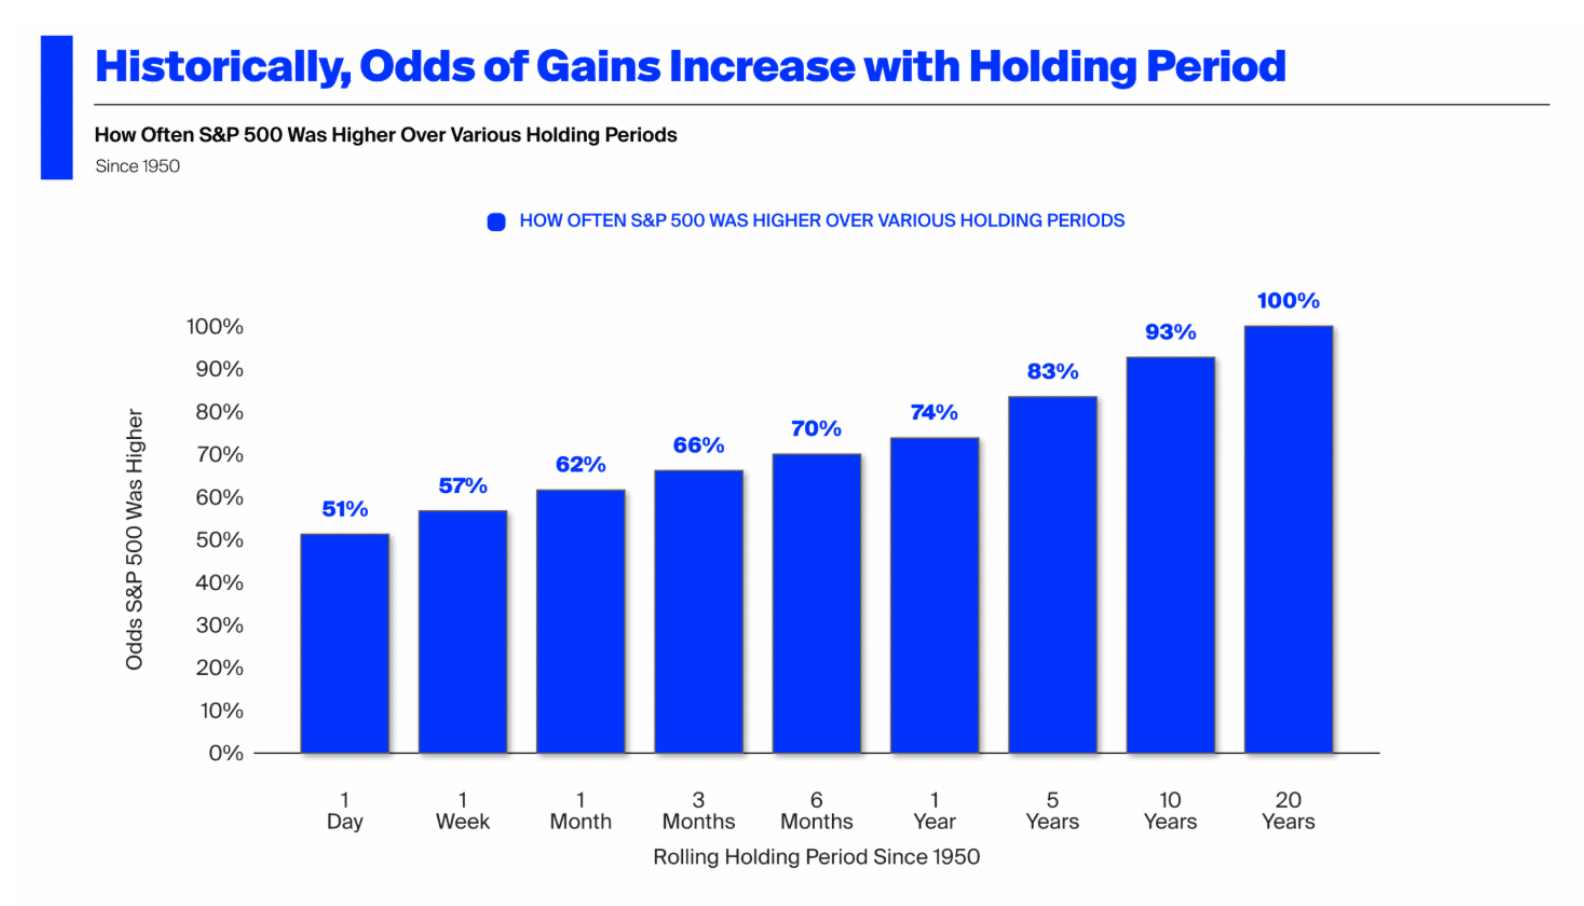
Owning the market for:
The goal is to invest in the market, own the world, and do this for a long period of time.
Investing in the short term, that is risky. 26% of the time, you would have less dollars, which is not horrible. But when the market goes down, it goes down sharply and quickly.
Invest for the long term, save for the short term.
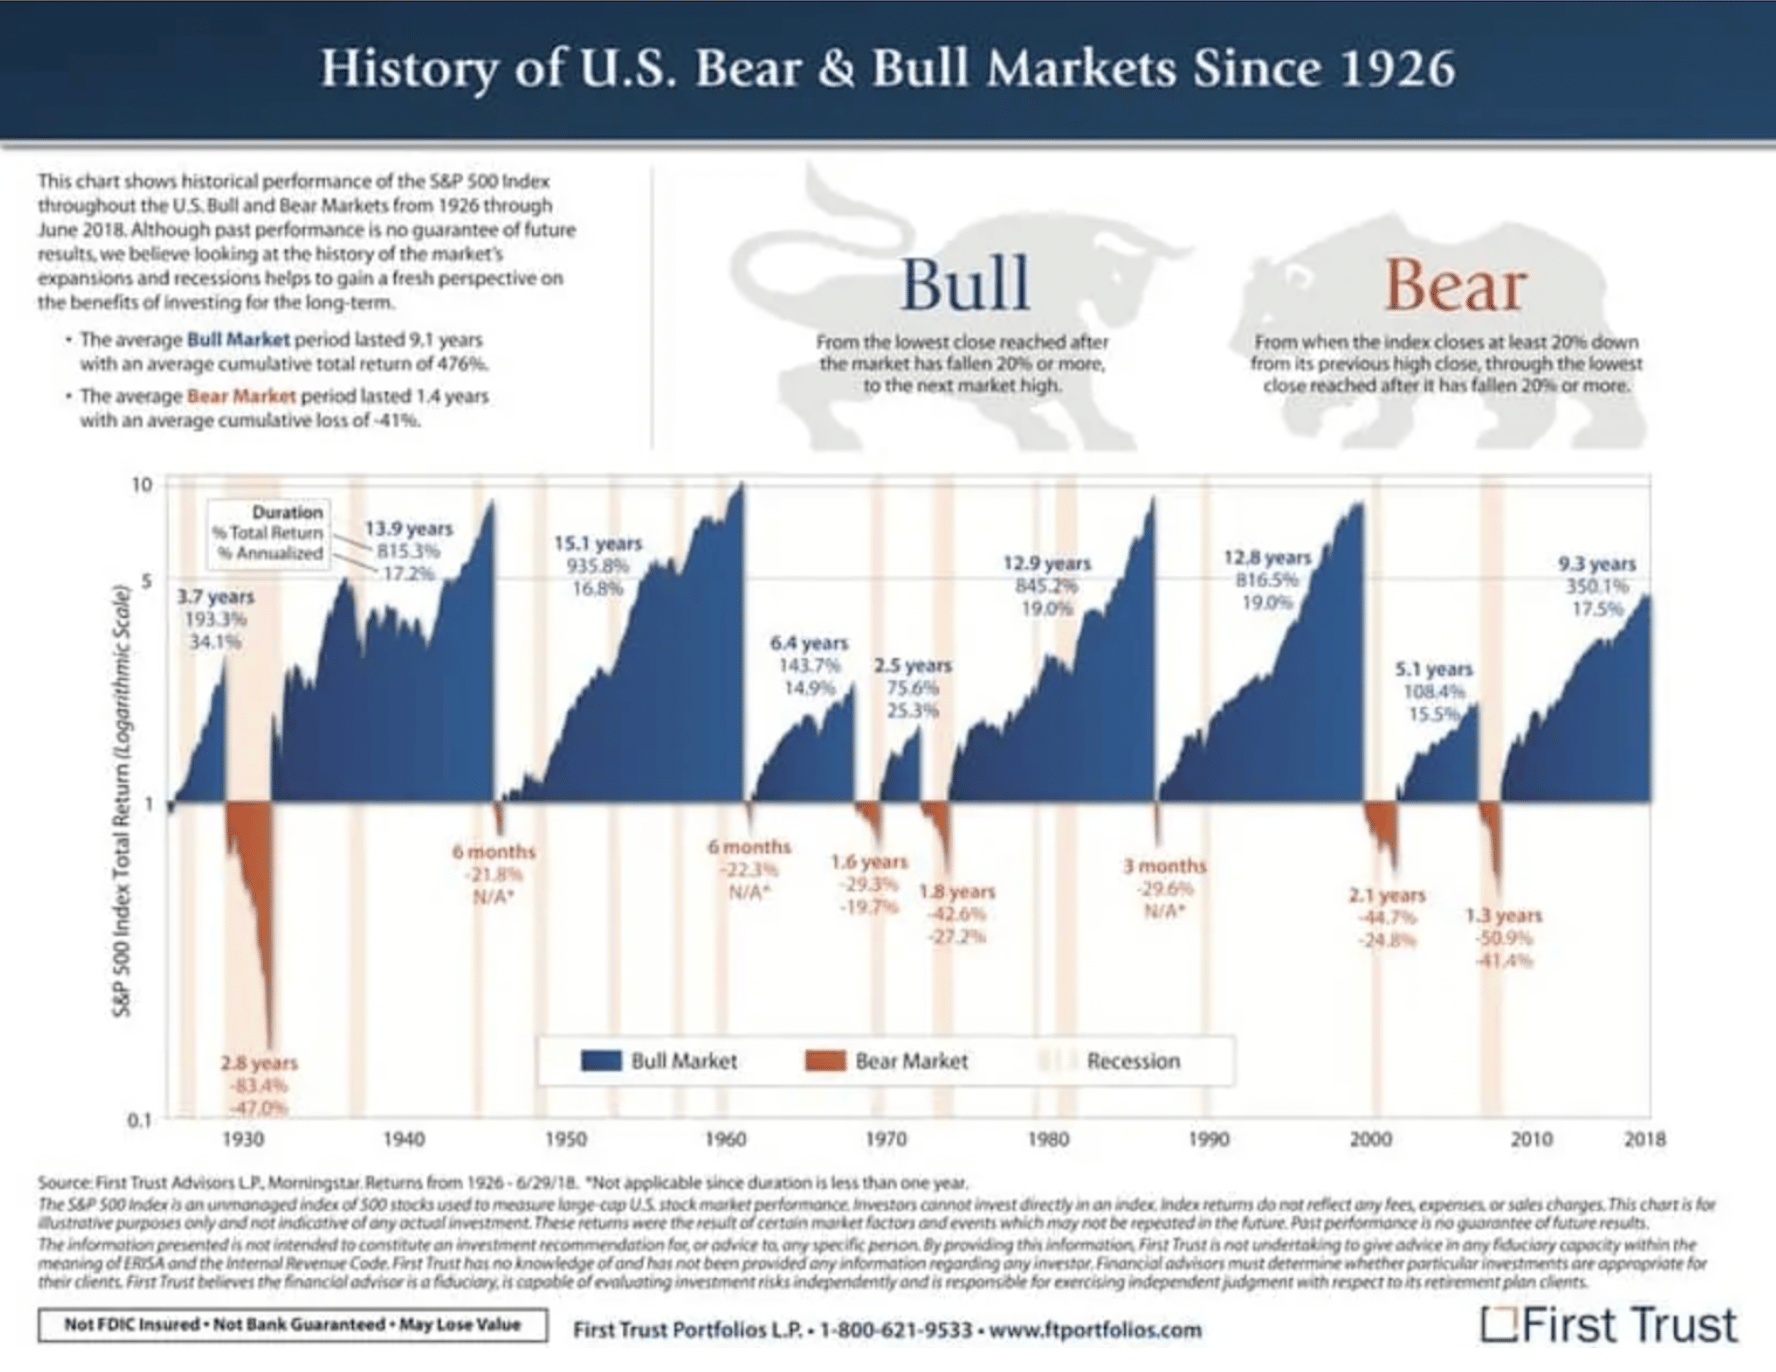
People try and do everything they can to avoid bear markets, but the truth is bear markets will happen, many, many times in your life.
But the average returns you see in the past, include those down periods.
Bull markets are long and see significantly higher returns.
The thing is, you have no idea when it will be one vs the other.
Most people predicted a recession this year, but look where we are at.
New investors see the market go down 5-10% and panic.
Why?
Because they just hear that the market gets an average return of 10% so they think it’s a steady way up.
It’s far from that.
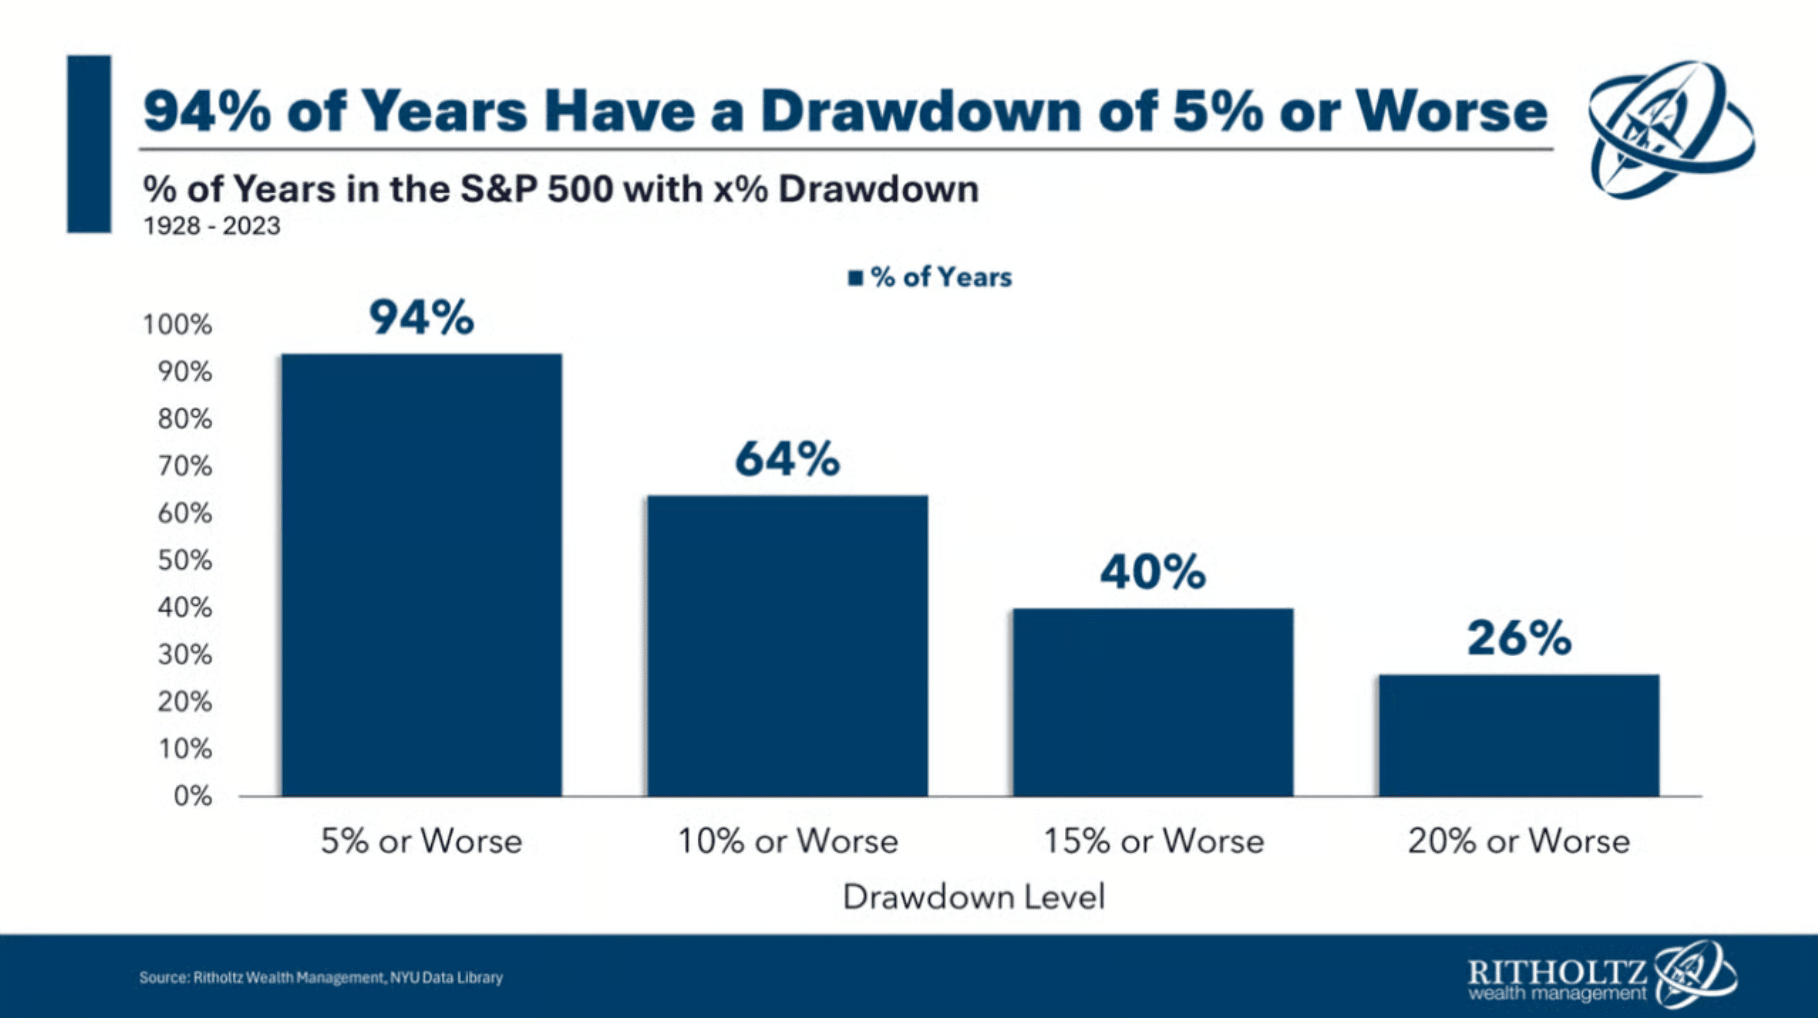
94% of years see a drawdown of over 5%
And 64% of years see a drawdown of 10%, yet 74% of years you have positive returns.
You get paid because of the volatility and holding on.
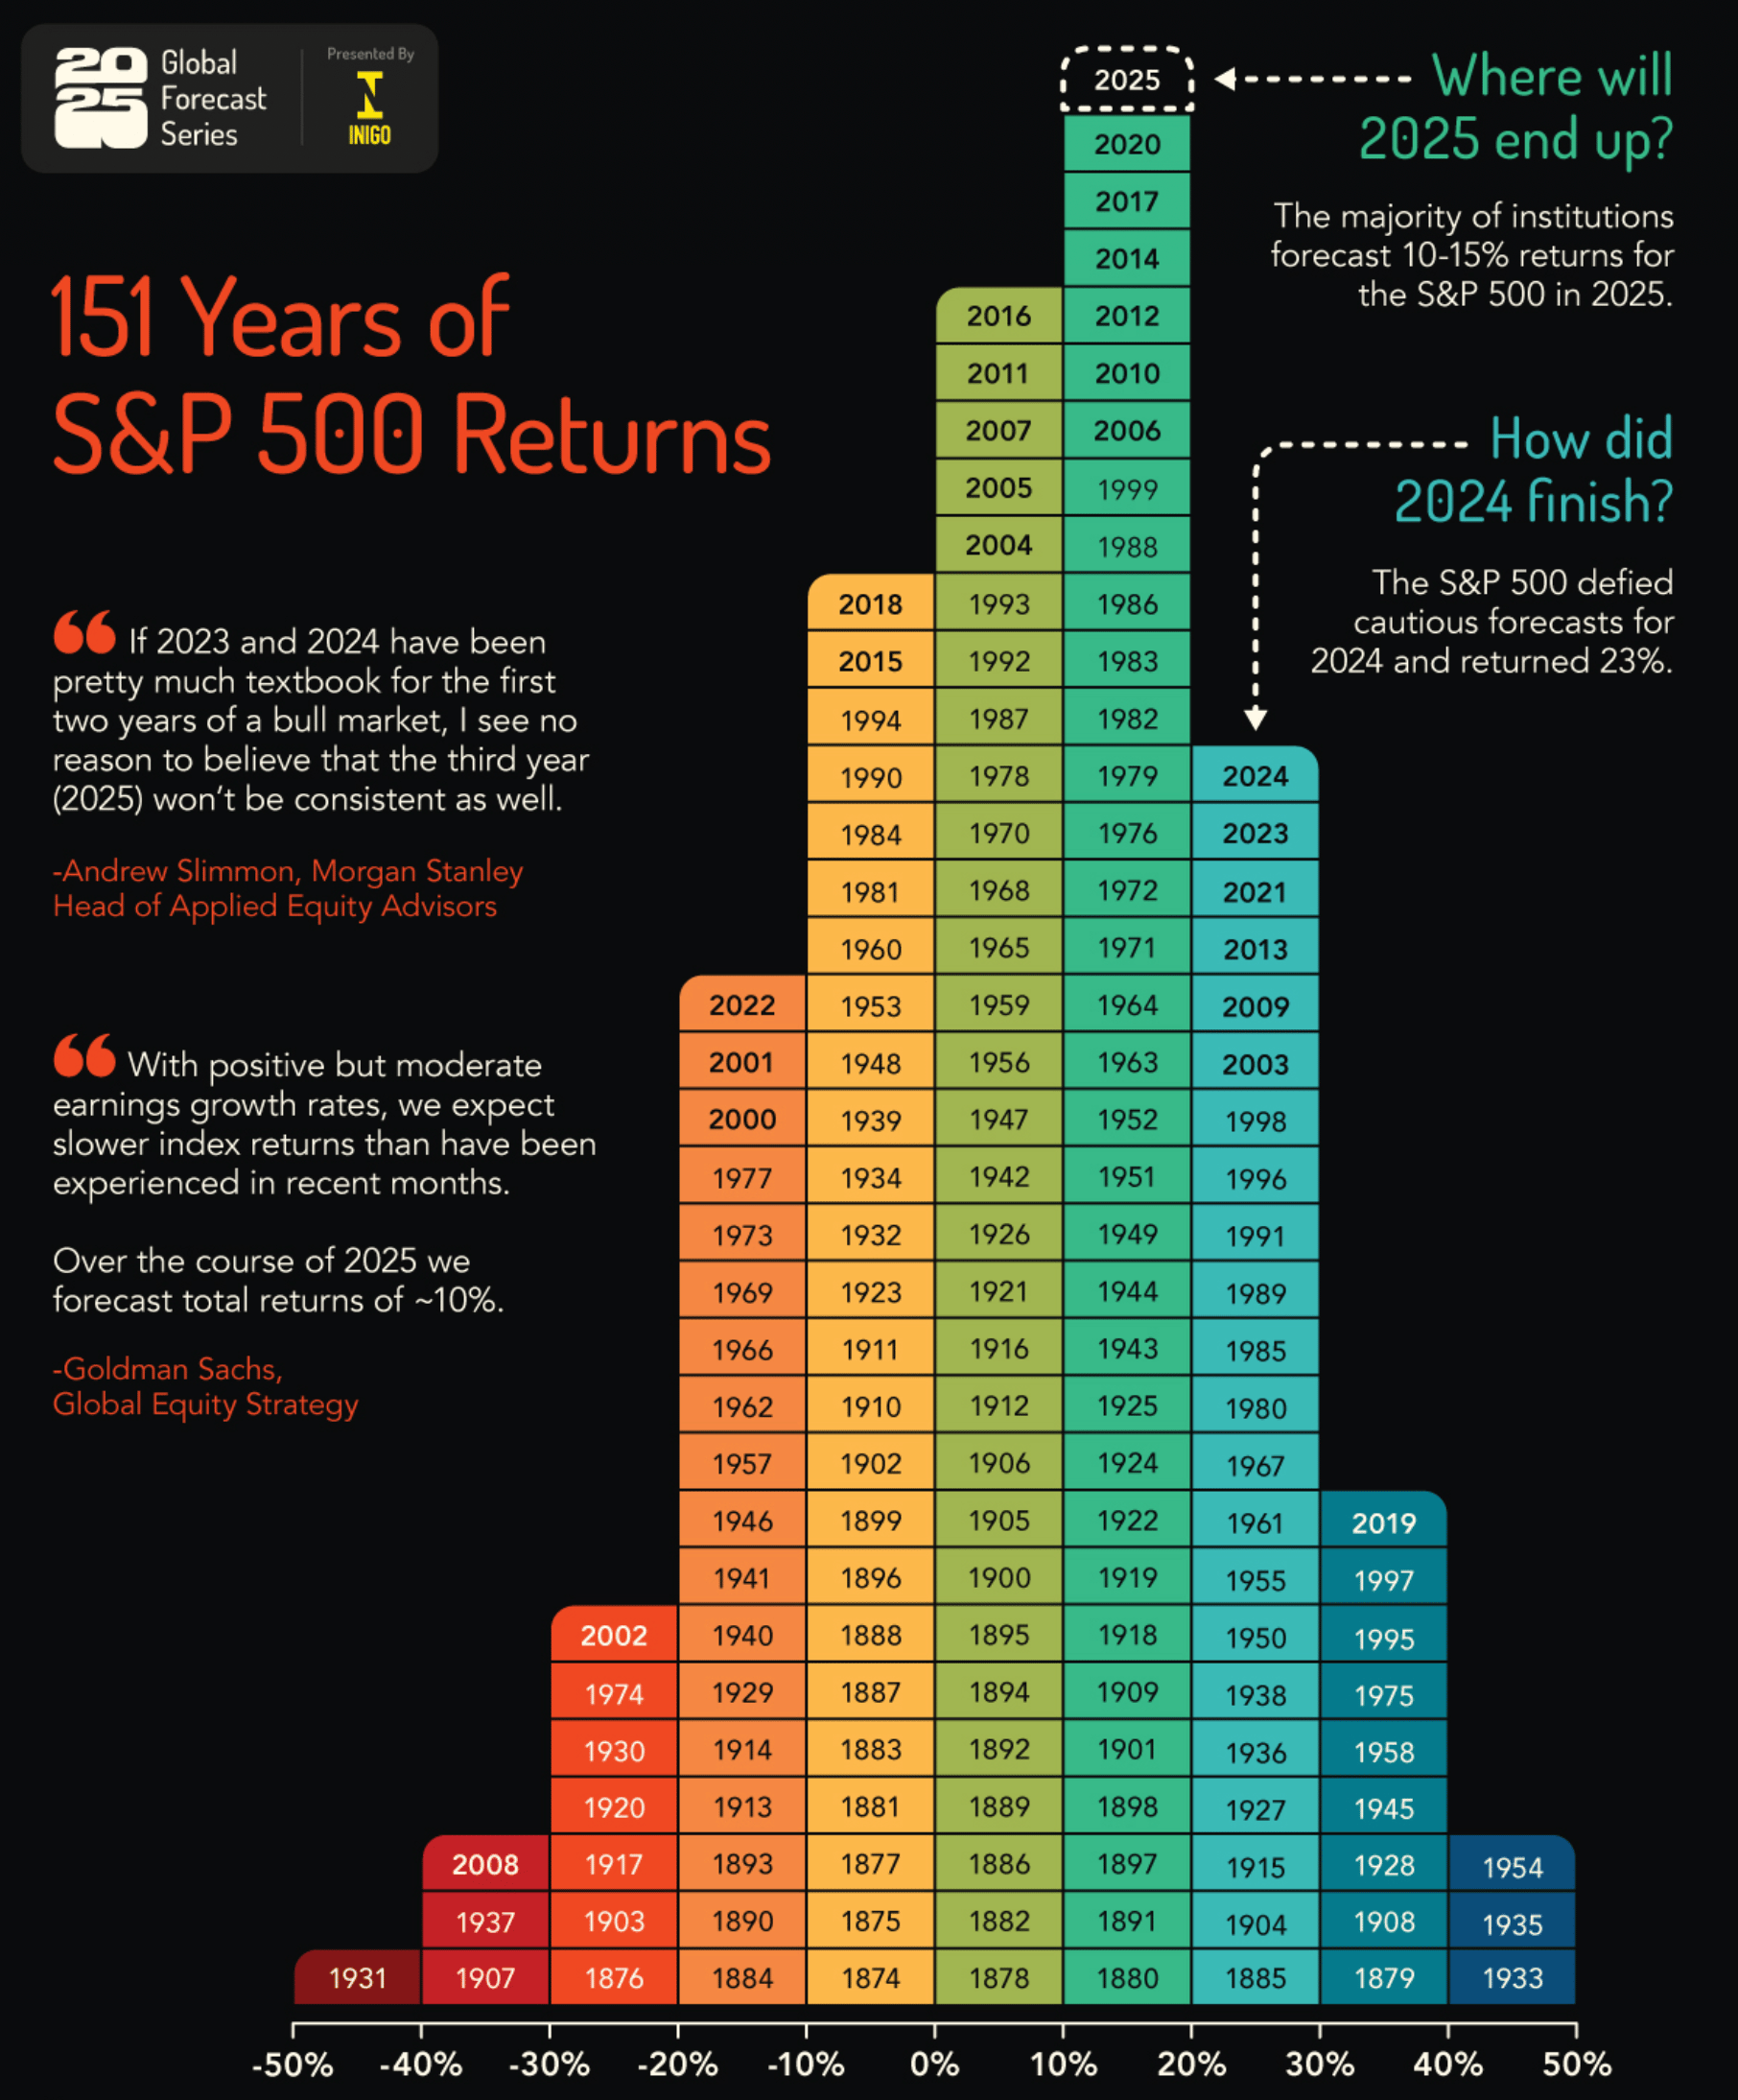
I just mentioned this a little bit, but it is important to dig into more.
Like I said, most hear the market averages over 10%, so they assume most years it is close to that, but that’s not the reality of it.
As you can see from the chart below, there are a lot of years with 20%+ returns and -10%+.
The market is all over the place and rarely looks like 10%.
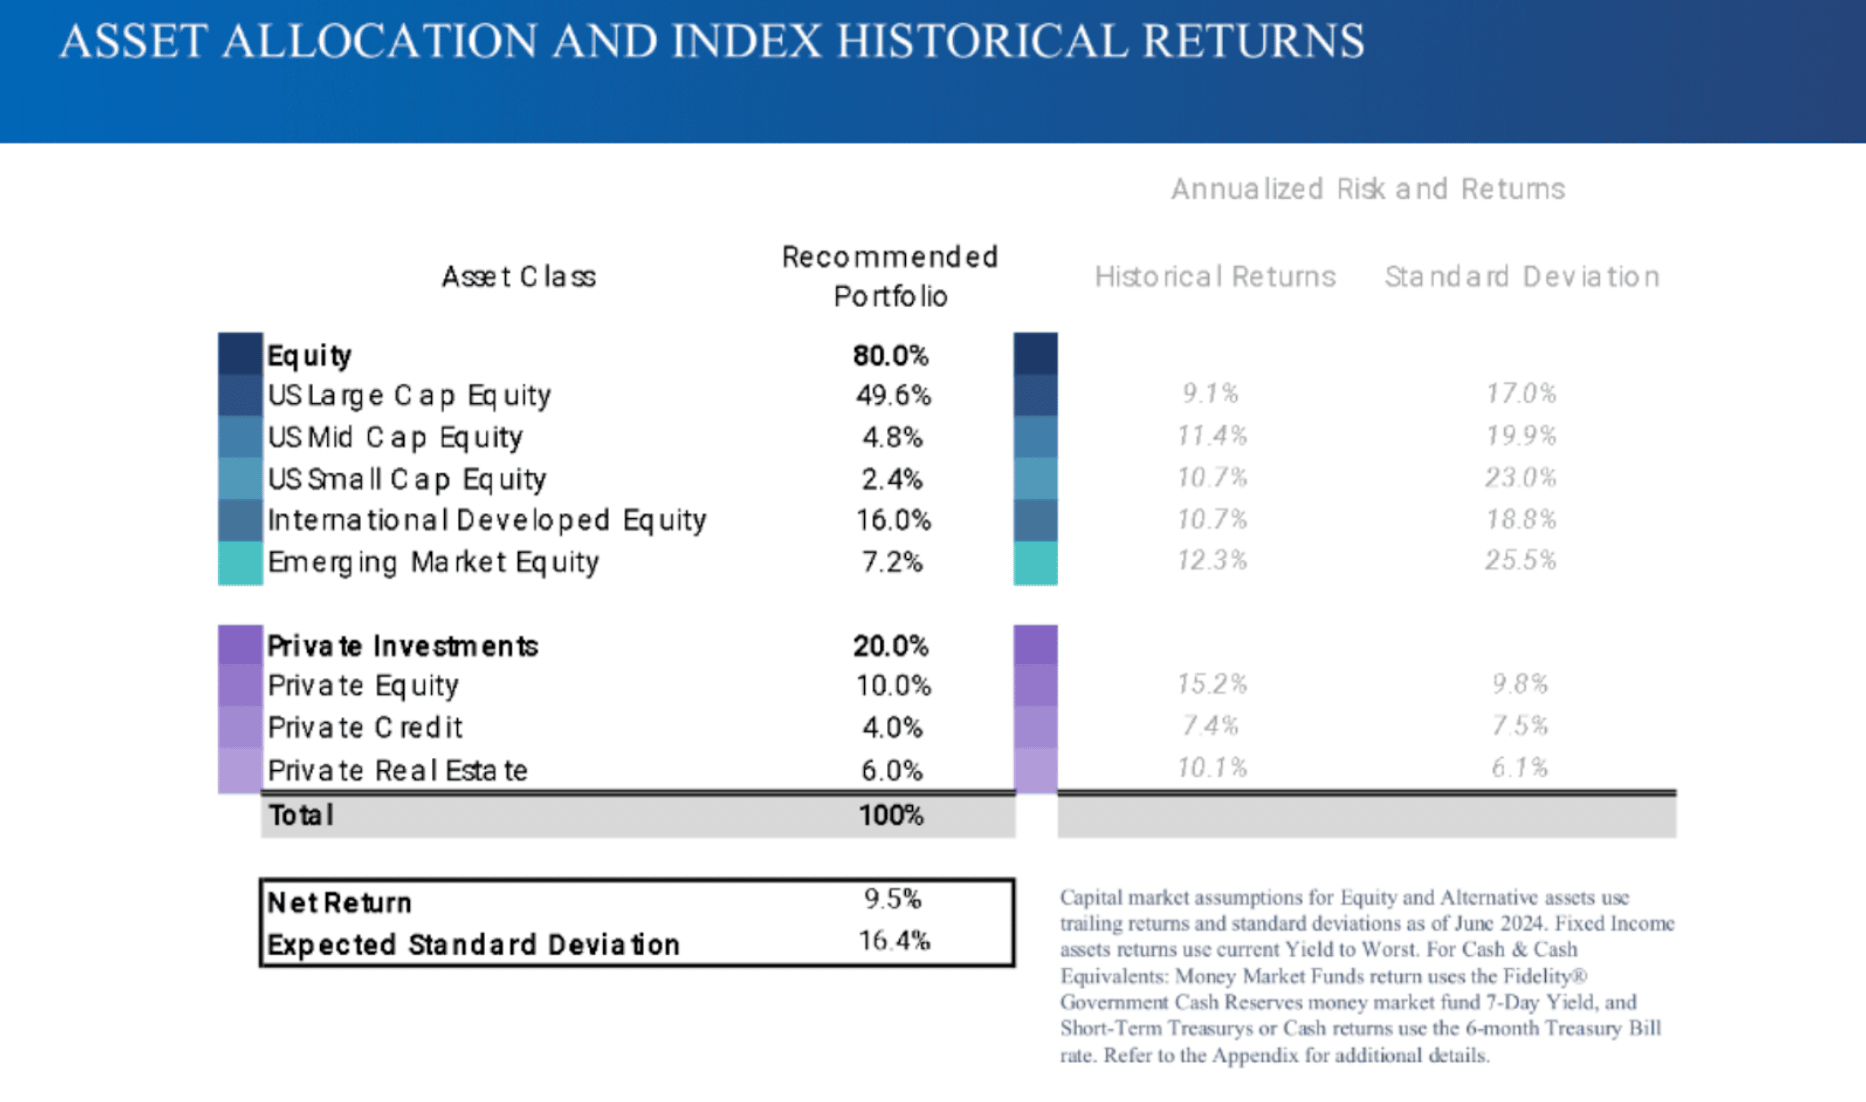
Most people think the S&P 500 and large cap are the highest growing asset class over the past 100+ years. But that is not the reality of it. The chart below shows historical returns with standard deviation.
You will see that mid cap, small cap, international developed, and emerging markets have performed better.
Right now, most asset managers are predicting very low returns in US large cap due to how expensive it is relative to earnings and the runup that has happened since 2008.
What do I think the next 10 years look like? Do I think they are right?
I have no idea. That is why I am diversified and own ETF’s that get me exposure to the whole world.
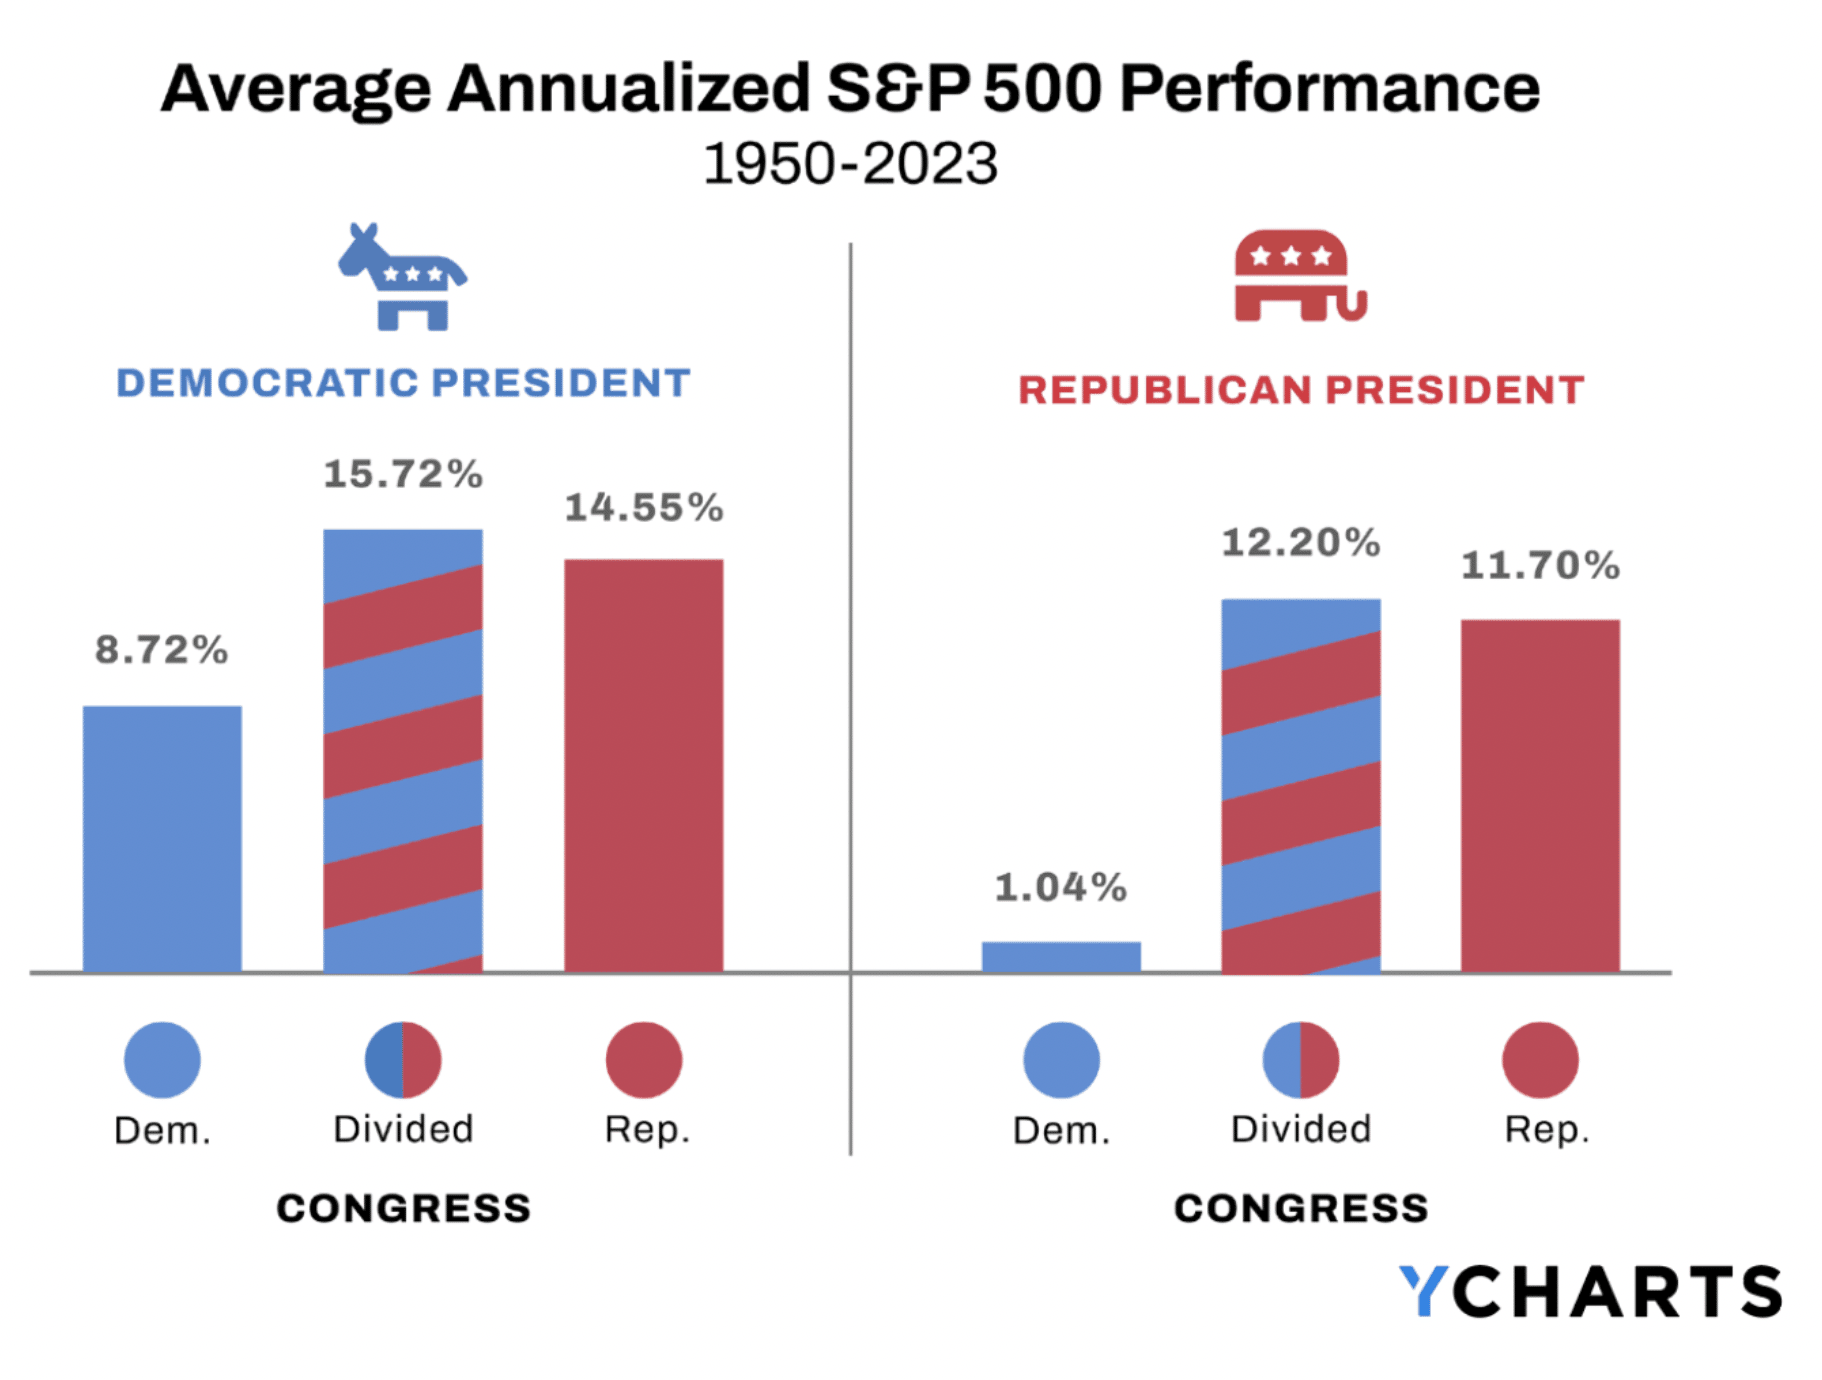
I always get a ton of questions about the market and worries about the next president. But statistically, the market does well regardless of who is in office.
Most are surprised to see that the market has higher returns when a democratic president is in office and when congress is divided.
The point is, there is no need to change your investment strategy when the president changes.
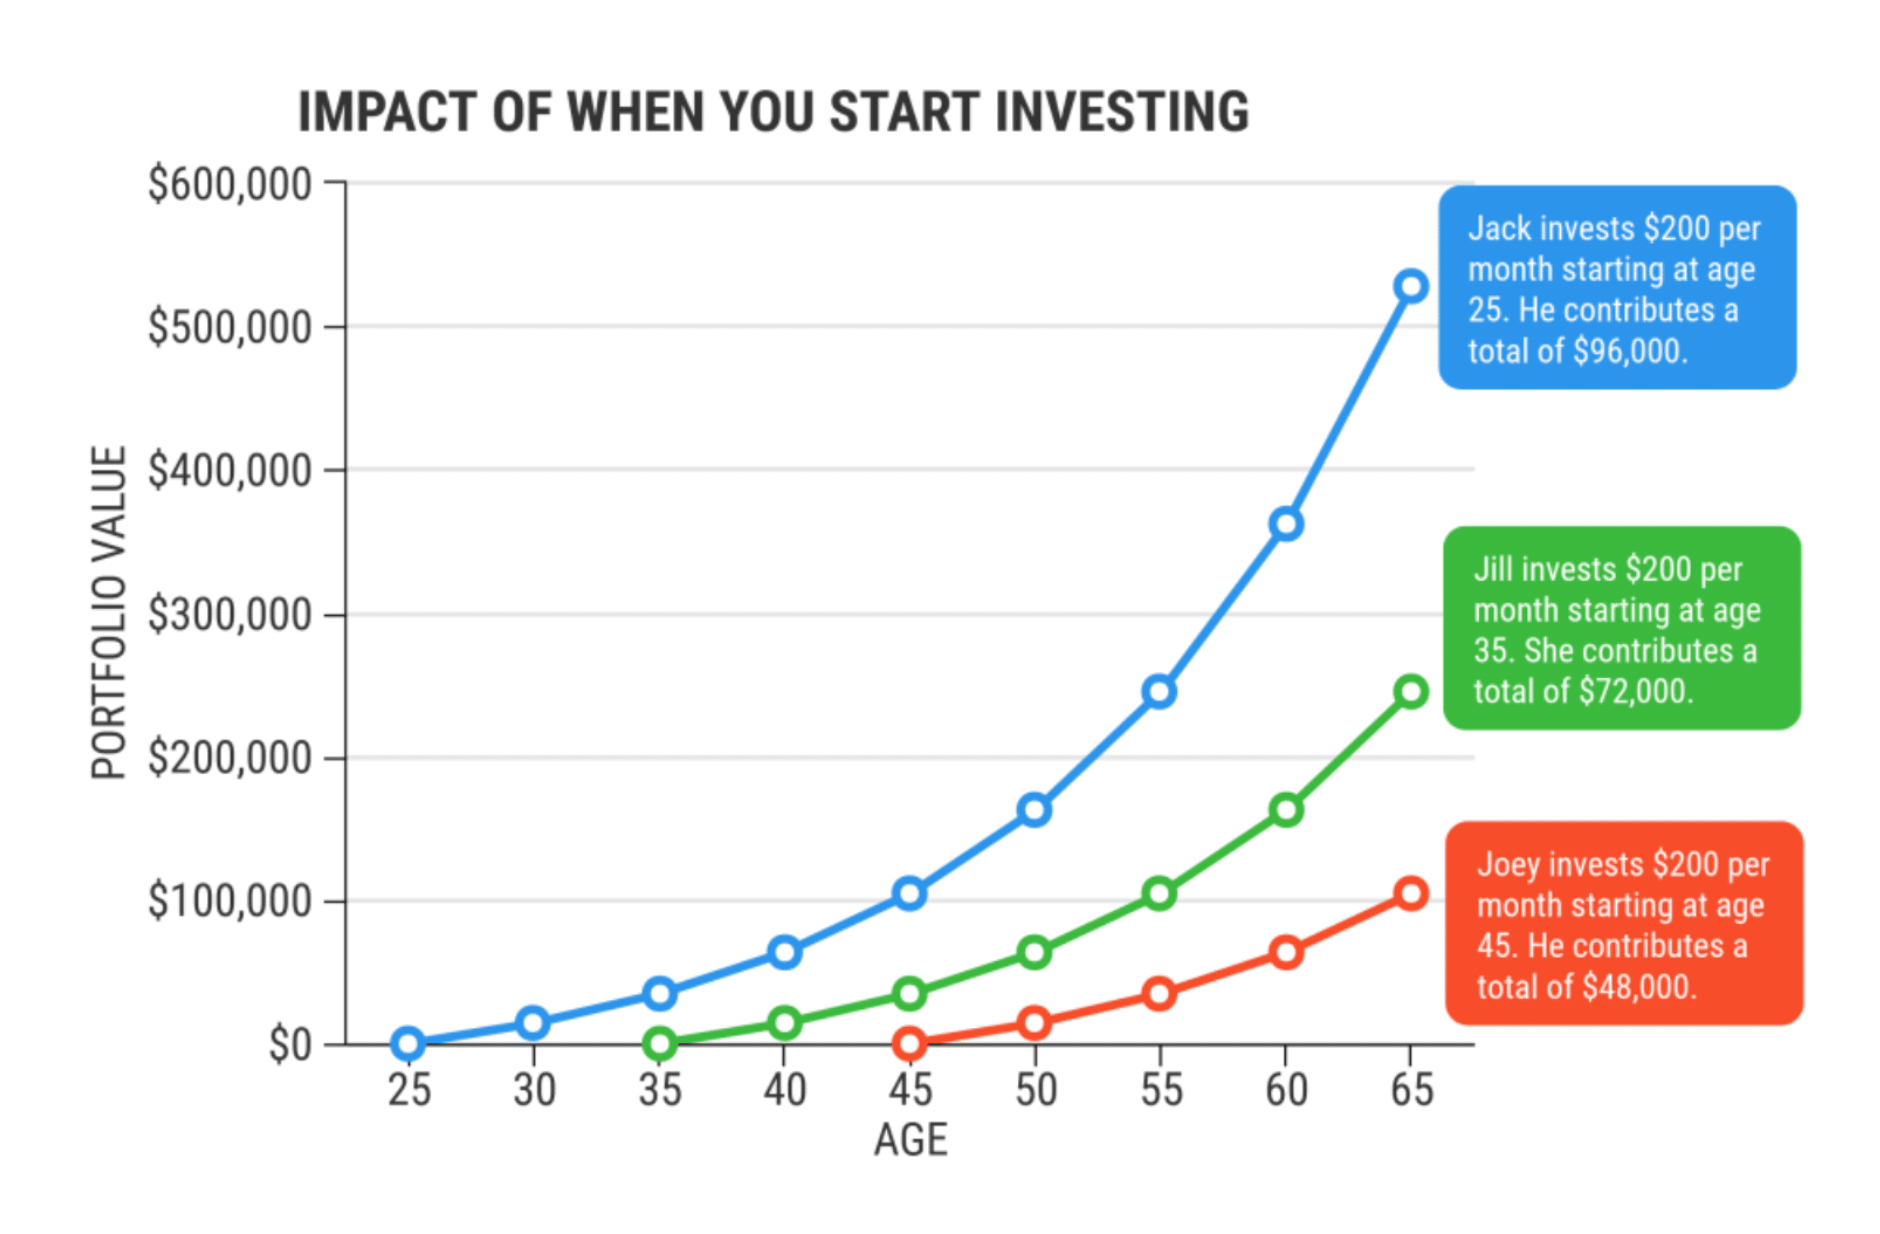
I don’t think I can reiterate this one enough, the goal is to invest for as long as possible.
This chart below does a great job of showing the impact of that.
It shows the long term portfolio difference of investing at 25 vs 35 vs 45.
The person who started at 25 ended up with over double the amount as some who started at 35 and over 5x as the person who started at 45.
Once you learn the value of compound interest and getting 1 to 2 extra doubles in, you realize the goal is to invest as much as you can as early as possible.
“I will wait for things to settle down.”
I cannot tell you how many people have said this in 2020, 2022, 2024, and 2025 and are still sitting in cash.
Pretty much every year there’s some big reason to sell or to not invest.
Whether it was:
It’s always a bad time in people’s minds.
Yet look at how the market has done through all those reasons to sell.
I would say it has done pretty well.
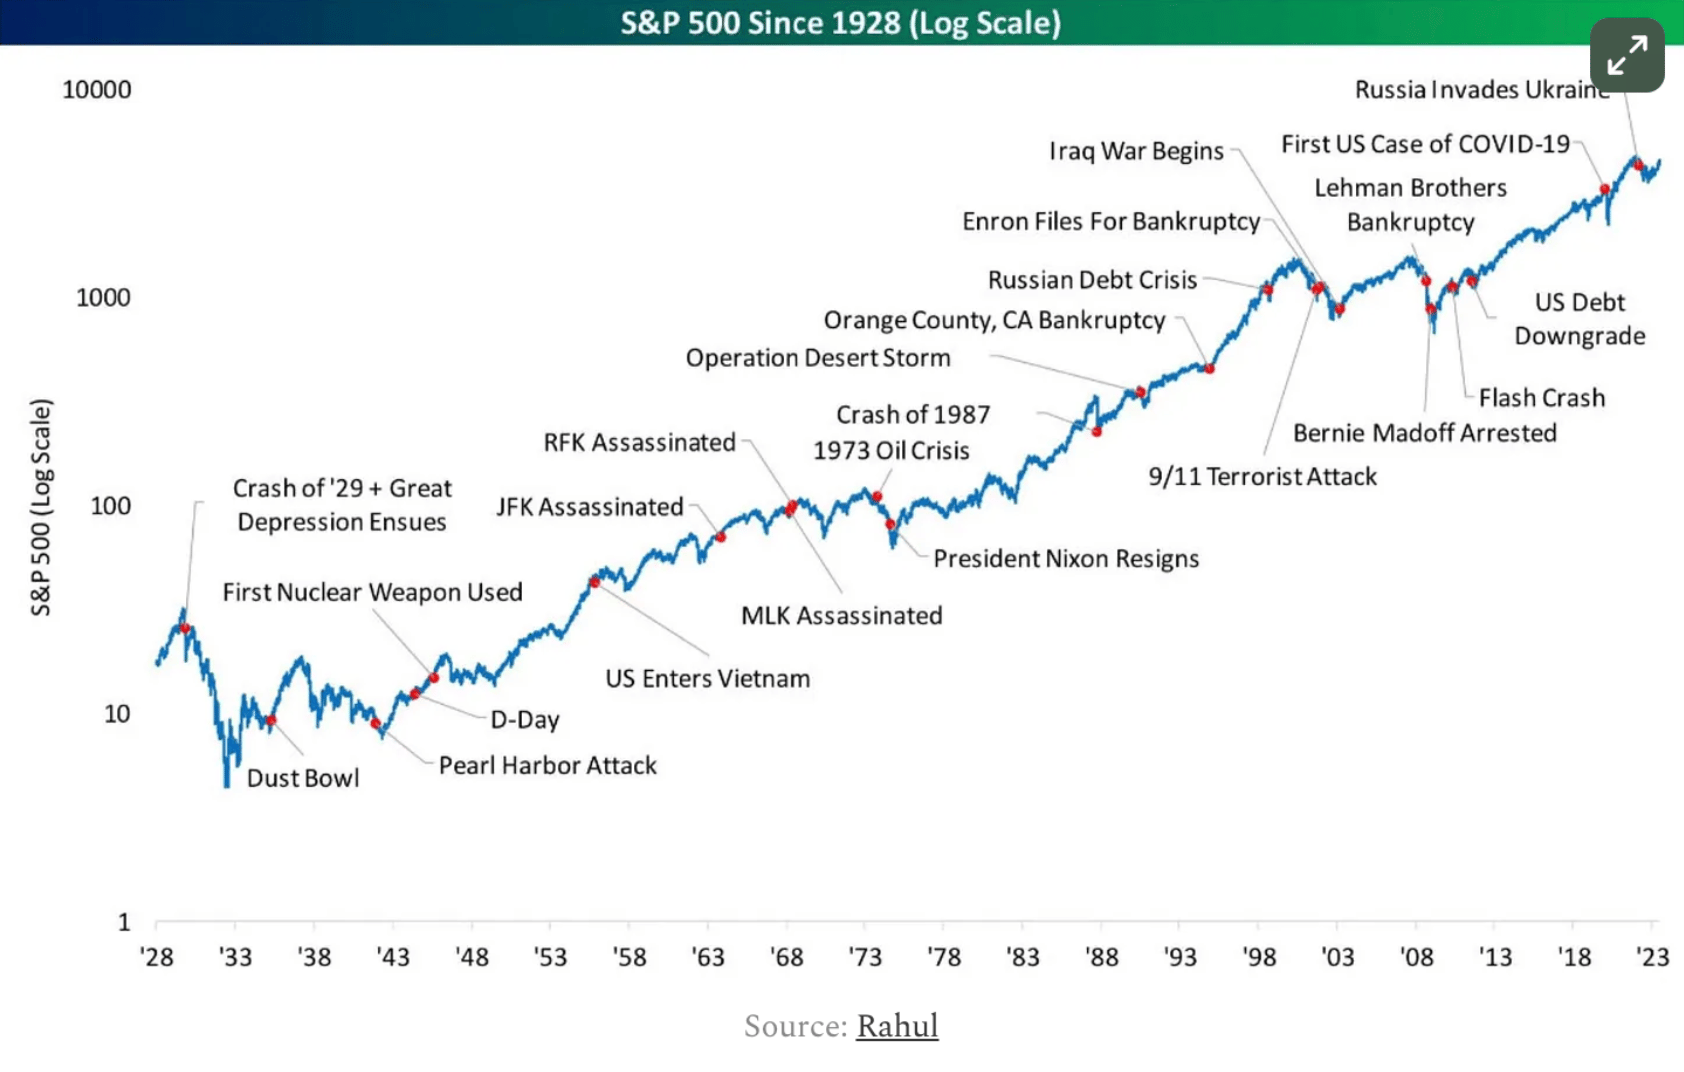
Ignore the news. Ignore the noise. Keep investing.
Whenever things get tough for you, I challenge you to come back to this post and look through these charts.
It will make you a better long term investor.

Financial Advisor